
 LinkBack URL
 About LinkBacks

In the series of chaos engineering articles, we have been learning to simulate various performance problems. In this post, lets discuss how to simulate deadlock.
What is Deadlock?
Deadlock is prone in multi-threaded applications. The technical definition of a Deadlock goes like this: Deadlock is a situation where a set of processes are blocked because each process is holding a resource and waiting for another resource acquired by some other process. Few technical definitions arent clear. Above definition could be one of them. :-). But here is a practical example, which may help you to understand Deadlock.
Fig1: Trains starting in the same track
Fig2: Trains experiencing Deadlock
Lets say there is only one train track and this train track has six parts(part-1, part-2, part-3, part-4, part-5, part-6). Lets say Train-A starts at part-1 and Train-B starts at Part-6 on the same train track at the same time. Lets say both trains travel at the same speed. Under this circumstance, Train-A and Train-B will reach a Deadlock state when they reach part-3 and part-4 of the train track. Because when Train-A is in part-3 of the train track, it will be stuck waiting for part-4 of the track, which Train-B holds. On the other hand, when Train-B is in part-4, it will be stuck waiting for part-3, which Train-A holds. Thus, both trains cant move forward. This is a classic Deadlock situation. Once a Deadlock happens in the application, it can not be recovered. The only way to recover from Deadlock is to restart the application.
Java Deadlock Program
Here is a sample program from the open source BuggyApp application, which generates deadlock between 2 threads.
package com.buggyapp.deadlock;

public class DeadLockDemo {
   public static void start() {
      new ThreadA().start();
      new ThreadB().start();
     }
}

public class ThreadA extends Thread {
    @Override
    public void run() {
        CoolObject.method1();
    }
}

public class ThreadB extends Thread {
    @Override
     public void run() {
          HotObject.method2();
      }
}

public class CoolObject {
    public static synchronized void method1() {
          try {
	    // Sleep for 10 seconds
	     Thread.sleep(10 * 1000);
          } catch (Exception e) {
          }
          HotObject.method2();
     }
}

public class HotObject {
   public static synchronized void method2() {
       try {
	// Sleep for 10 seconds
	Thread.sleep(10 * 1000);
             } catch (Exception e) {
        }
         CoolObject.method1();
     }
}
You can notice the sample program contains the DeadLockDemo class. This class has a start() method. In this method, 2 threads with the name ThreadA and ThreadB are launched.
run() method in ThreadA invokes CoolObject#method1(). Similarly run() method in ThreadB invokes HotObject#method2().
If you notice both CoolObject#method1() and HotObject#method2() are synchronized methods. When a method is synchronized only one thread who has the lock of that object can execute that method. If another thread tries to execute the method, it will go into BLOCKED state, until the first thread completes executing the method. After entering the respective methods, both threads sleeps for 10 seconds and then continue to invoke other method i.e. CoolObject#method1() will invoke HotObject#method2() and HotObject#method2() will invoke CoolObject#method1().
So lets visualize what happens when above program is executed:
ThreadA acquires CoolObjects lock.
ThreadB acquires HotObjects lock.
ThreadA waits for HotObjects lock.
ThreadB waits for CoolObjects lock.
Thus both threads will end up in classic Deadlock.
How to troubleshoot Deadlock?
You can diagnose Deadlock either through a manual or automated approach.
Manual approach
In the manual approach, you need to capture thread dump from the application suffering from Deadlock. Thread dump is a snapshot of all the threads that are running in the application. It contains thread names, thread Ids, thread state, code execution path, lock level details. You can capture thread dump using one of the 8 approaches given here. Once the thread dump is captured, you need to import the thread dump from your production servers to your local machine. You can use thread dump analysis tools like fastThread, samurai to analyze the thread dumps from your local machine.
Automated approach
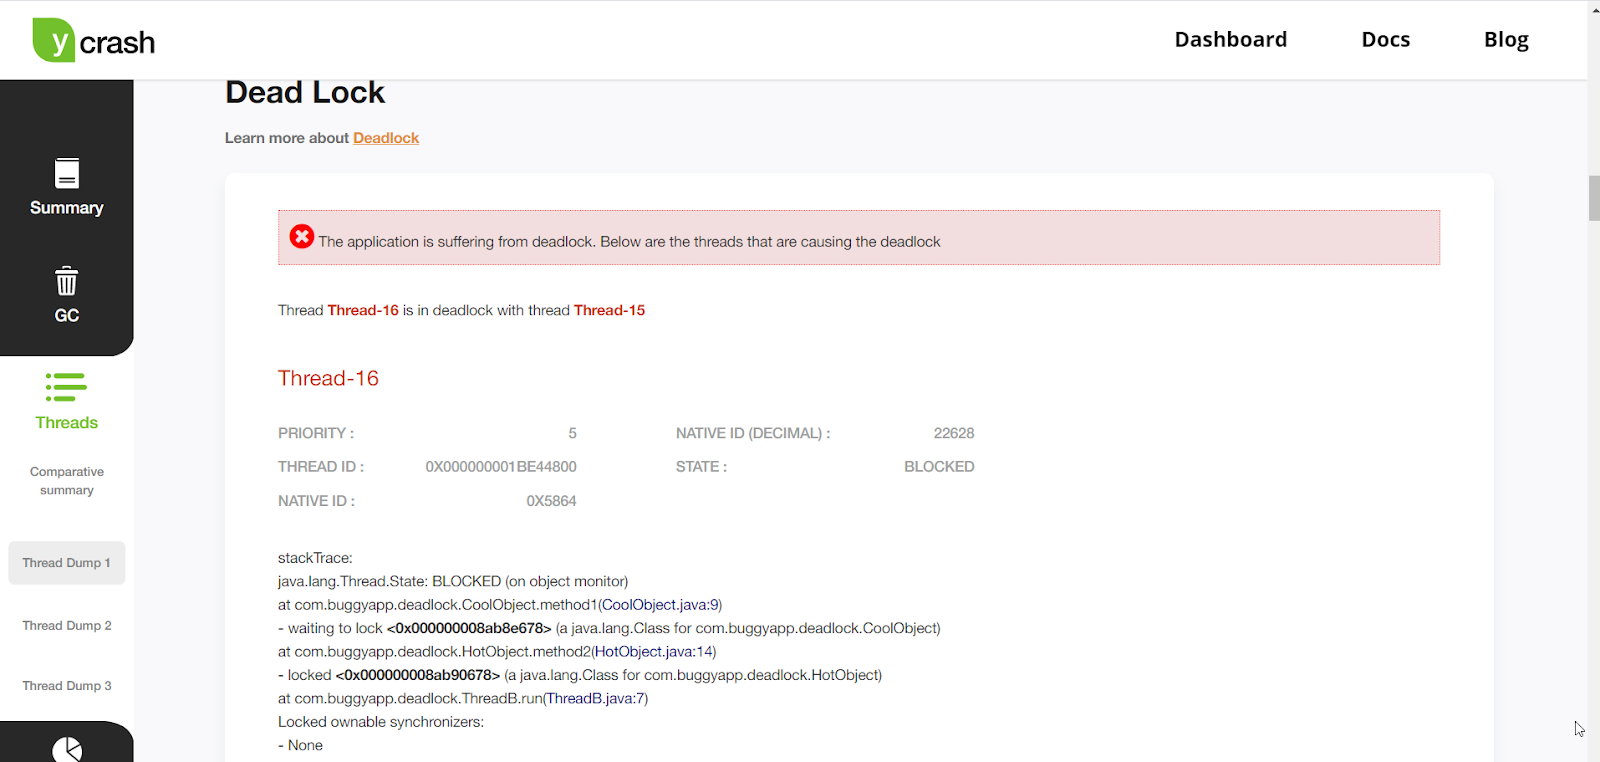
You can use root cause analysis tools like yCrash which automatically captures application-level data (thread dump, heap dump, Garbage Collection log) and system-level data (netstat, vmstat, iostat, top, top -H, dmesg, ). Besides capturing the data automatically, it marries these two datasets and generates an instant root cause analysis report. Below is the report generated by the yCrash tool when the above sample program is executed:
Fig: yCrash tool pointing out the root cause of deadlock
You can clearly see yCrash reporting Thread-16 and Thread-15 suffering from Deadlock. yCrash also reports the stack trace of Thread-16 and Thread-15. From the stack trace you can notice Thread-16 acquiring lock of HotObject, but waiting for CoolObject lock. On the other hand Thread-15 acquired the lock of CoolObject, but waiting for HotObject lock. Now based on this stacktrace we know the exact code that is causing the problem.


 Reply With Quote