
 LinkBack URL
 About LinkBacks

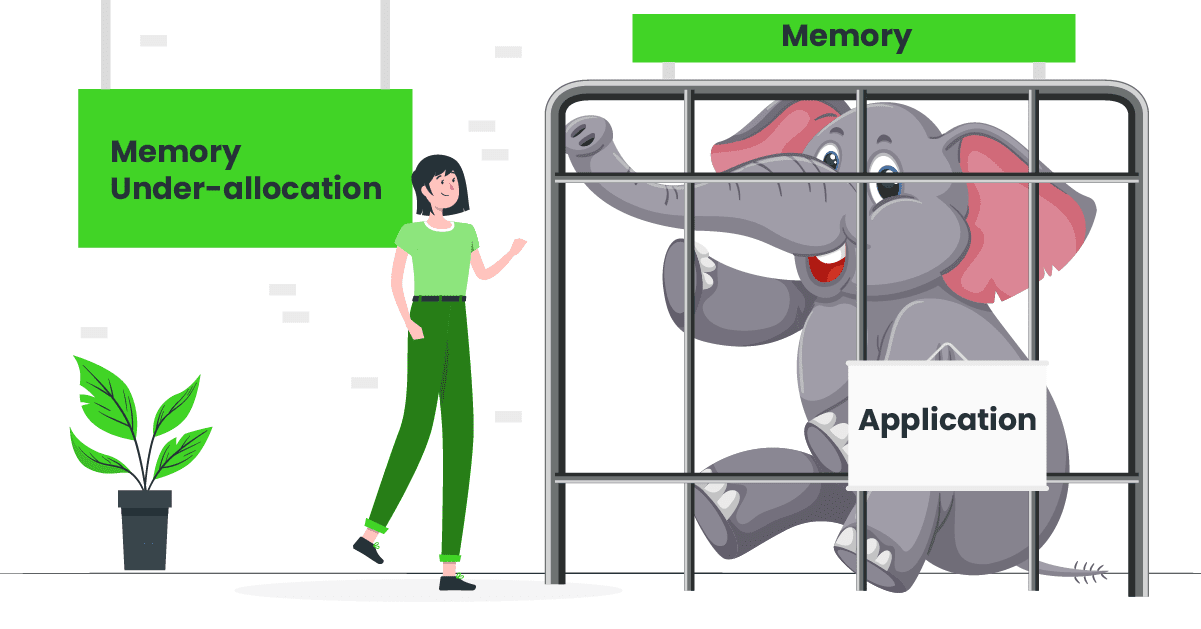
When the applications memory is under-allocated, it will result in the following side-effects:
a. Transactions response time will degrade
b. CPU consumption will spike up
c. OutOfMemoryError will be thrown
Only when OutOfMemoryError is thrown, most of us start to look at our applications memory settings. This is like only when a patient goes to a critical condition; we begin to give treatment :-).
In this post, lets discuss how to detect whether your applications memory is under-allocated or not in a proactive manner.
Study the Garbage Collection behavior
Studying the garbage collection behavior of the application will clearly indicate whether your applications memory is under-allocated or over-allocated than the actual requirement. You can study the garbage collection behavior of your application by following these two simple steps:
1. To study the Garbage collection behavior, you first need to enable the Garbage collection log on your application. Garbage collection log can be enabled by passing the JVM arguments mentioned in this post. Enabling garbage collection log doesnt add any observable overhead to your application. Thus you can consider enabling garbage collection log on all your production JVMs.
2. Once garbage collection logs are captured, you can use free GC log analysis tools such as GCeasy, IBM GC Visualizer, Google garbage Cat, HP Jmeter to study the Garbage Collection behaviour.
Lets discuss what metrics and patterns you need to look in the Garbage Collection report to determine whether your applications memory is under-allocated or not.
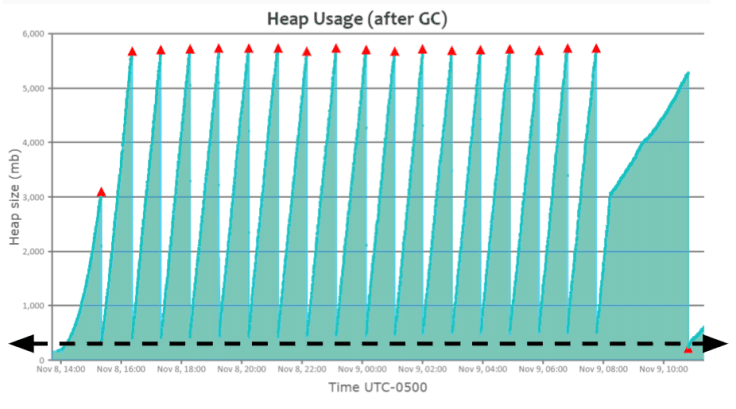
Healthy Normal application
Fig 1: Healthy normal application GC pattern
Above is the heap usage graph generated by the GCeasy tool by parsing the garbage collection log file. As shown in the above graph, you can see a beautiful saw-tooth pattern. Heap usage will keep rising; once a Full GC event is triggered, heap usage will drop all the way to the bottom. It indicates that the application is in a healthy condition.
In Fig 1, You can notice that Full GC event (i.e., red triangle) runs approximately when the heap usage reaches ~5.8GB. When the Full GC event runs, memory utilization drops all the way to the bottom i.e., ~200MB (Please refer to the dotted black arrow line in the graph). It indicates that the application is in a healthy state & not suffering from any sort of memory problems.
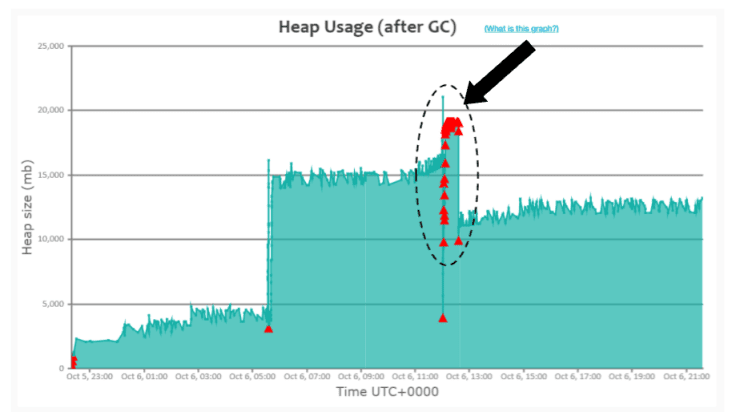
Memory under-allocated application pattern-1
Fig 2: Consecutive Full GC pattern generated
In Fig 2. you can notice that from 12:02pm to 12:30 pm on Oct 06, Full GCs (i.e., red triangle) are consecutively running (Please refer to the black arrow mark); however, heap usage isnt dropping during that time frame. It indicates that the application is creating a lot of objects during that time frame. Application was creating a lot of new objects because of the spike in traffic volume during that time frame. Since objects are created at a rapid phase, GC events also started to run consecutively.
Whenever a GC event runs, it has two side effects:
a. CPU consumption will go high (since GC does an enormous amount of computation).
b. Entire application will be paused; no customers will get response.
Thus, during this time frame, 12:02pm to 12:30pm on Oct 06, applications CPU consumption would have been skyrocketing and customers wouldnt be getting back any response. Here is the real-world GC log analysis report which was suffering from this Consecutive Full GC problem. When this kind of pattern surfaces, its a clear indication that your application needs more memory than what you have allocated.
When this problematic pattern surfaces, you can also follow one of the approaches outlined in this post to resolve the problem.
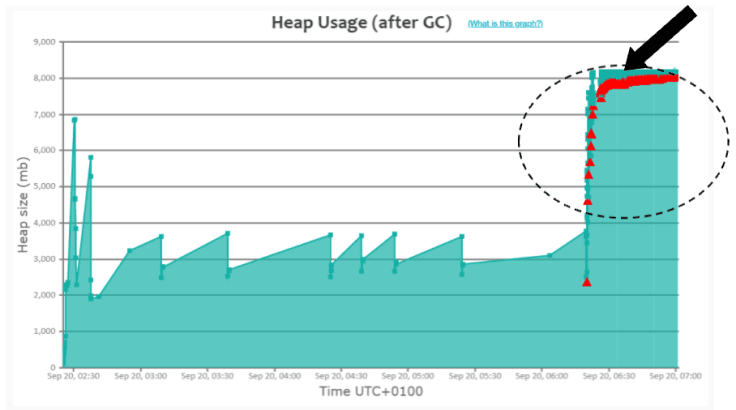
Memory under-allocated application pattern-2
If you notice in Fig 2, after 12:30pm on Oct 6, application recovered and started to function normally. Its because traffic volume died down after 12:30pm. Once traffic volume died down, applications object creation rate went down. Since the object creation rate went down, Full GCs also stopped running consecutively. However, in certain applications, you might see the GC pattern to appear like this as well:
Fig 3: Potential Memory Leak GC pattern
Please refer to the black arrow in Fig 3. You can notice that Full GC (i.e., red triangle) events are continuously running.
Here is the real-world GC log analysis report, which depicts this pattern. This pattern is similar to the previous pattern as highlighted in Fig 2, with one sharp difference. In the previous pattern, application recovered from consecutive Full GC runs and returned to a normal functioning state once traffic volume died down. However, in Fig 3, consecutive Full GCs never stopped running until the application got restarted. When you see Fig 3 type of pattern, there could be two possibilities:
a. Application needs more memory (due to spike in traffic volume)
b. Application is suffering from a memory leak
Now the question is: How to isolate whether its #a or #b causing this problematic pattern?. Try removing your JVM instance from the load balancer and stop the traffic. If the problem is triggered because of the spike in traffic volume, Full GCs will stop running, and heap usage will drop back to the normal level. However, Full GCs will continue to run consecutively if its a memory leak, and heap usage will not drop back to the normal level.
Note: If the application is suffering from memory leak, you can use tools like yCrash, HeapHero, Eclipse MAT to diagnose memory leak. Here is a more detailed post on how to diagnose Memory leak
Conclusion
Thus, by performing Garbage collection log analysis as outlined in this post, you would be able to determine whether your applications memory is under-allocated or not in a proactive manner.
Video
https://youtu.be/btnI7qRTb3U

 Reply With Quote