
 LinkBack URL
 About LinkBacks

When we launch applications, we specify the initial memory size and maximum memory size. For the applications that run on JVM (Java Virtual Machine), initial and maximum memory size is specified through -Xms and -Xmx arguments. If Java applications are running on containers, its specified through -XX: InitialRAMPercentage and -XX: MaxRAMPercentage arguments. Most enterprises set the initial memory size to a lower value than the maximum memory size. As opposed to this commonly accepted practice, setting the initial memory size the same as the maximum memory size has certain cool advantages. Lets discuss them in this post.
1. Availability
Say suppose you are launching your application with the initial heap size to be 2GB and maximum heap size to be 24GB. It means when the application starts, the operating system will allocate 2GB of memory to your application. From that point, as the application starts to process new requests, additional memory will be allocated until a maximum of 24GB is reached.
Say suppose while your applications memory consumption is in the process of growing from 2GB to 24GB, at that time, say some other process(es) gets launched in your device and it starts to consume memory. This situation is quite common in production/cloud environments, especially where your application runs with few other neighbors (such as custom scripts, cron jobs, monitoring agents ).
When this situation happens, your application will either experience:
1.java.lang.OutOfMemoryError: Java heap space
2.Operating System will terminate your application with Out of memory: Kill process ____ (java) score ____ or sacrifice child.
It means, your application will crash in the middle of the transaction. If your application is launched with maximum memory during the startup time itself, then your application will be safe. The operating system will only terminate newly launched scripts/cron jobs whose memory consumption is growing and not your application whose memory was already fully allocated during the startup time. For more details about this issue, you may refer to this post
2. Performance
We have also observed applications launched with the same initial heap size and maximum heap size tend to perform comparatively better than applications launched with lower initial heap sizes.
Here is a real-world case study: We took a memory-intensive application HeapHero for our study. This application processes very large size binary heap dump files and generates analytics reports. In this HeapHero application, we repeatedly analyzed an 11GB binary file, so that it will put memory pressure on the operating system.
We conducted two test scenarios:
Scenario 1: We set the initial heap size to be 2GB and the maximum heap size to be 24GB.
Scenario 2: We set both initial and maximum heap size to be 24GB.
In Scenario #1, we observed the average response time to be 385.32 seconds, whereas in Scenario #2, we observed the average response time to be 366.55 seconds. There was a 5.11% improvement in the response time. This improvement in response time was happening due to 2 reasons:
a. Memory allocation and deallocation from OS
b. GC Pause time impact
Lets discuss them here:
a. Memory allocation and deallocation from OS
When you have set the different sizes for the initial and maximum heap size, then the JVM will have to negotiate with the Operating System to allocate memory when there is a need. Similarly, when an applications demand for memory goes down at the run time, Operating System will take away the allocated memory. This constant allocation and deallocation will add overhead to the application.
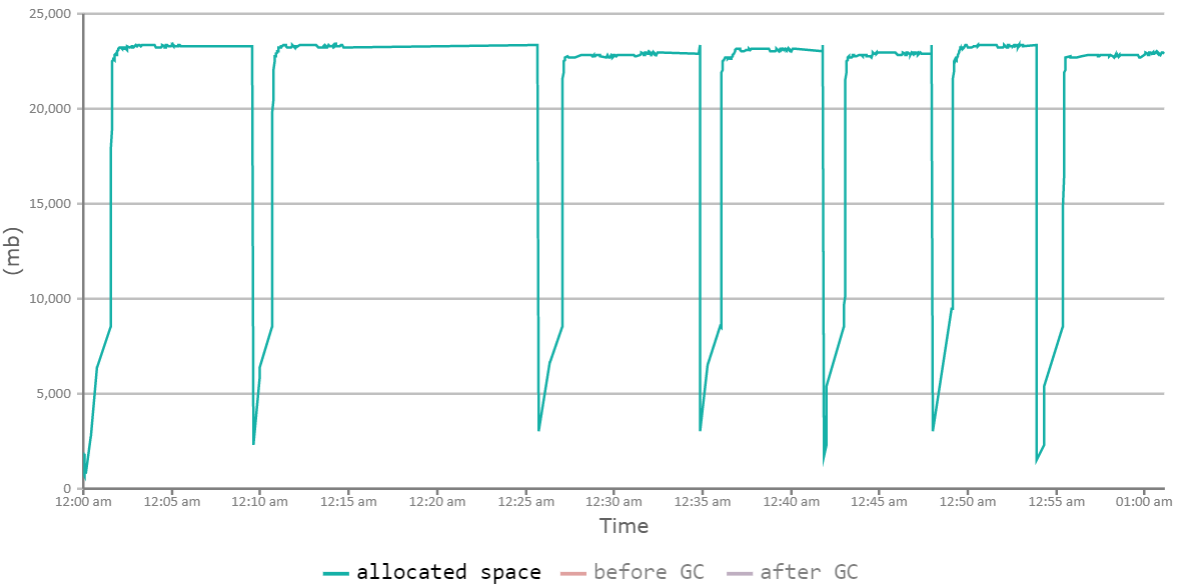
Fig: Scenario 1 memory allocation fluctuating (graph by GCeasy)
The above graph shows Scenario 1 JVMs allocated & deallocated memory. From the graph, you can notice that memory is constantly fluctuating. You can see heap size fluctuating between 2GB to 24GB. When the application processes heap dump, memory shoots up to 24GB. After processing, memory drops back to 2GB. Once again when it processes a new heap dump, memory shoots back to 24GB.
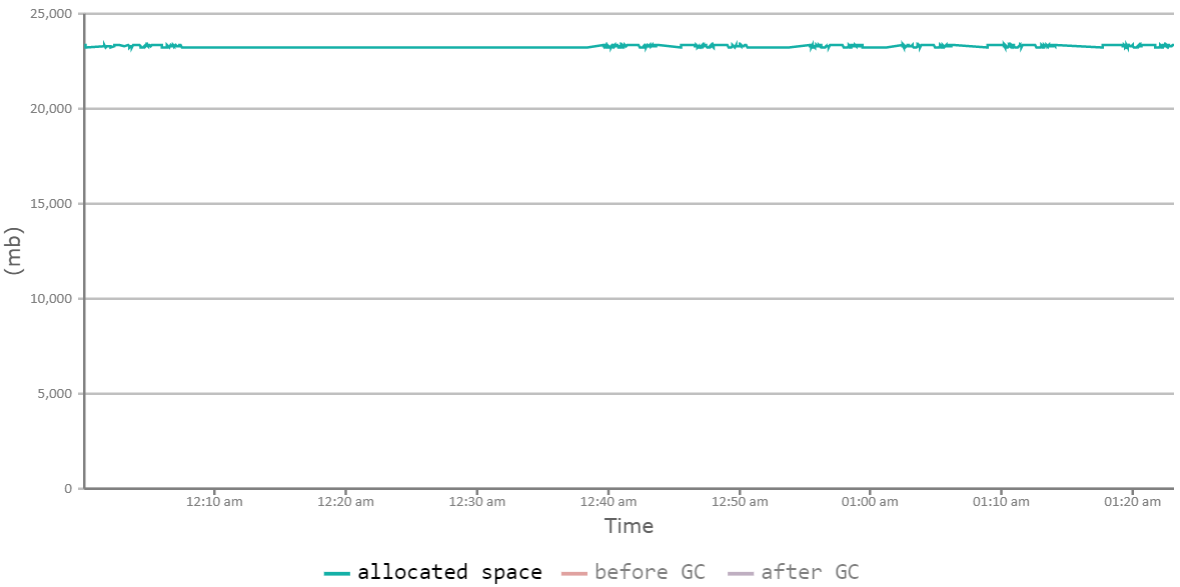
Fig: Scenario 2 memory allocation constant (graph by GCeasy)
The above graph shows Scenario 2 JVMs allocated memory during its lifetime. You can see that there is no fluctuation. Memory is reserved from the operating system during the startup time and from that point, there is no fluctuation. It always remains at 24GB irrespective of the activity in the application. This behavior has the potential to boost the applications performance to a certain degree.
b. GC Pause time impact:
When Garbage collection runs, it pauses your application which will have a negative customer impact. We studied the Garbage collection performance of both scenarios using the GCeasy tool. Below are the results:
Scenario GC Throughput Avg GC Pause time Max GC
Scenario 1: initial heap size set lower than the max heap size 96.59% 99.2 ms 5.23 sec
Scenario 2: initial heap size set same as max heap size 97.83% 97.0 ms 1.65 sec
We noticed that there was minor degradation in the GC throughput and GC pause times. In scenario #1, GC throughput was 96.59%, whereas in scenario #2 GC throughput was slightly better 97.83%. Similarly in scenario #1, the Max GCs pause time was 5.23 seconds, whereas in scenario #2 it was only 1.65 seconds. (If you would like to learn more about Garbage Collection KPIs and tuning, you may refer to this video clip).
If you would like to see the detailed metrics of the Garbage collection behavior between these two scenarios, you can refer to the reports here: Scenario 1 GC report, Scenario 2 GC report
3. Application Startup Time
Your applications startup time will also be better if you set the initial heap size to be the same as the maximum heap size. Below is the excerpt from the Oracle documentation
If the initial heap is too small, the Java application startup becomes slow as the JVM is forced to perform garbage collection frequently until the heap grows to a more reasonable size. For optimal startup performance, set the initial heap size to be the same as the maximum heap size.
4. Cost
Irrespective of whether you set your initial heap size (-Xms) and maximum heap size (-Xmx) to the same value or different value, the computing cost ($) that you pay to your cloud hosting provider will not change. Say suppose you are using 2.2x. large 32G RHEL on-demand AWS ec2 instances in US West (North California), then you will end up paying $ 0.5716/hour, irrespective of what value to set initial heap size and maximum heap size. Cloud providers dont charge you based on how much memory you use in that machine. They charge only based on the time you use the instances. Thus, there is no cost saving in setting the initial heap size lower than the maximum heap size.
Conclusion
Configuring the initial heap size to be less than the maximum heap size makes sense when you are configuring the thread pool or connection pool. In these resources over-allocating will have an unnecessary impact, however, it isnt the case with memory. Thus if you are building enterprise applications, you should strongly consider setting your initial heap size and maximum heap size to the same value.
Video
https://youtu.be/TzSrz4cMWgU


 Reply With Quote