
 LinkBack URL
 About LinkBacks

In this series of simulating and troubleshooting performance problems in Scala, lets discuss how to simulate the java.lang.OutOfMemoryError: Java Heap space problem. java.lang.OutOfMemoryError: Java Heap space will be thrown by the Scala application, when it generates more objects than the maximum configured heap size.
Video: To see the visual walk-through of this post, click below:
https://youtu.be/aoLHQsyCCyE
Scala OutOfMemoryError Program
Here is a sample Scala program, which generates the java.lang.OutOfMemoryError: Java Heap space problem:
This sample Scala program contains an OOMApp class. Since this class contains the while(true) loop, it keeps on inserting records into the HashMap infinitely. When HashMap grows beyond maximum heap size (i.e. -Xmx), the java.lang.OutOfMemoryError: Java Heap space will be thrown. The below diagram illustrates the records present in the HashMap.package com.yc import java.util class OOMApp { } object OOMApp { var myMap = new util.HashMap[String,String]() def main(args: Array[String]): Unit = { var counter = 0; while (true) { System.out.println("Inserting large String") myMap.put("key"+counter, "Large stringgggggggggggggggggggggggggggg" + "ggggggggggggggggggggggggggggggggggggggggggggggggggggg" + "ggggggggggggggggggggggggggggggggggggggggggggggggggggg" + "ggggggggggggggggggggggggggggggggggggggggggggggggggggg" + "ggggggggggggggggggggggggggggggggggggggggggggggggggggg" + "ggggggggggggggggggggggggggggggggggggggggggggggggggggg" + "ggggggggggggggggggggggggggggggggggggggggggggggggggggg" + "ggggggggggggggggggggggggggggggggggggggggggggggggggggg" + "ggggggggggggggggggggggggggggggggggggggggggggggggggggg" + "ggggggggggggggggggggggggggggggggggggggggggggggggggggg" + "ggggggggggggggggggggggggggggggggggggggggggggggggggggg" + "ggggggggggggggggggggggggggggggggggggggggggggggggggggg" + counter) counter = counter+(1); } } }
Fig: HashMap causing OutOfMemoryError
When we executed the above program, as expected, java.lang.OutOfMemoryError: Java heap space was thrown within few seconds.
Even though this is a hypothetical example that simulates java.lang.OutOfMemoryError, this is how a typical memory leak happens in enterprise applications. When records get inserted into a data structure (like HashMap, ArrayList, Set, etc), and never gets removed, java.lang.OutOfMemoryError will be thrown.
How to troubleshoot OutOfMemoryError?
You can diagnose OutOfMemoryError either through a manual or automated approach.
Manual approach
In the manual approach, you will need to capture heap dump as the first step. Heap dump is a snapshot of memory which will show all the objects in memory, values contained by those objects, and their references. You can capture heap dump using one of the 7 approaches given here. But an important criteria is: You need to capture the heap dump right before OutOfMemoryError is thrown. If you are going to capture a heap dump, after OutOfMemoryError has occurred, then leaking objects can get garbage collected, and it will become hard (or even impossible) to diagnose the problem. Once heap dumps are captured, you need to import the heap dumps from your production servers to your local machine. From your local machine, you can use heap dump analysis tools like jHat, HeapHero to analyze the heap dumps.
Automated approach
On the other hand, you can also use yCrash open source script, which would capture 360-degree data (GC log, 3 snapshots of thread dump, heap dump, netstat, iostat, vmstat, top, top -H, ) from your application stack within a minute and generate a bundle zip file. You can then either manually analyze these artifacts or upload it to yCrash server for automated analysis.
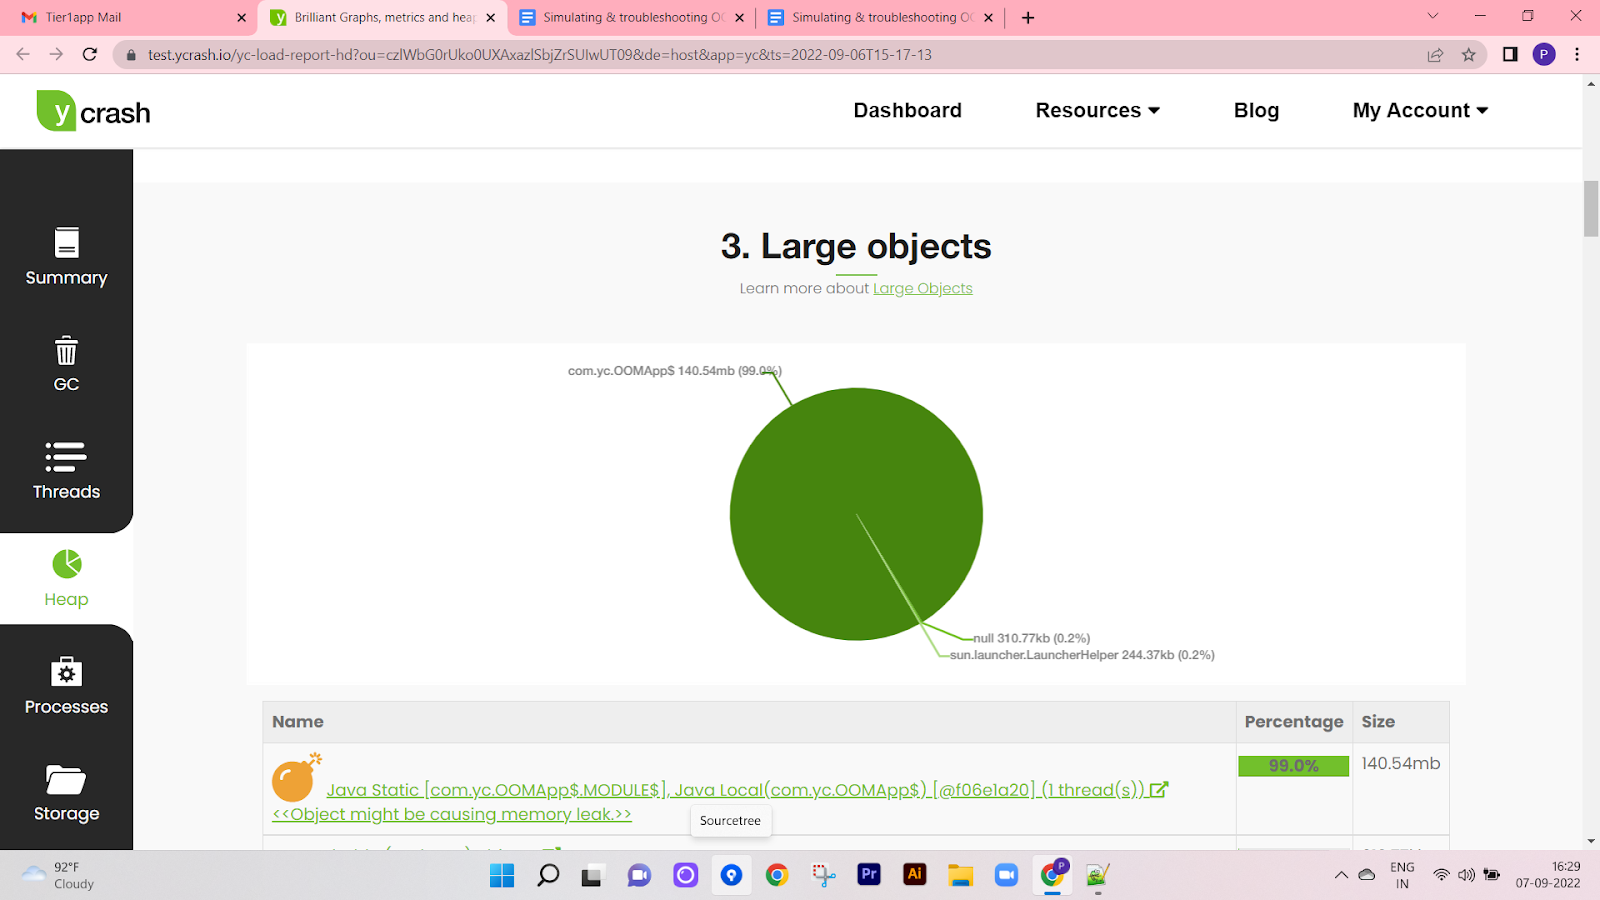
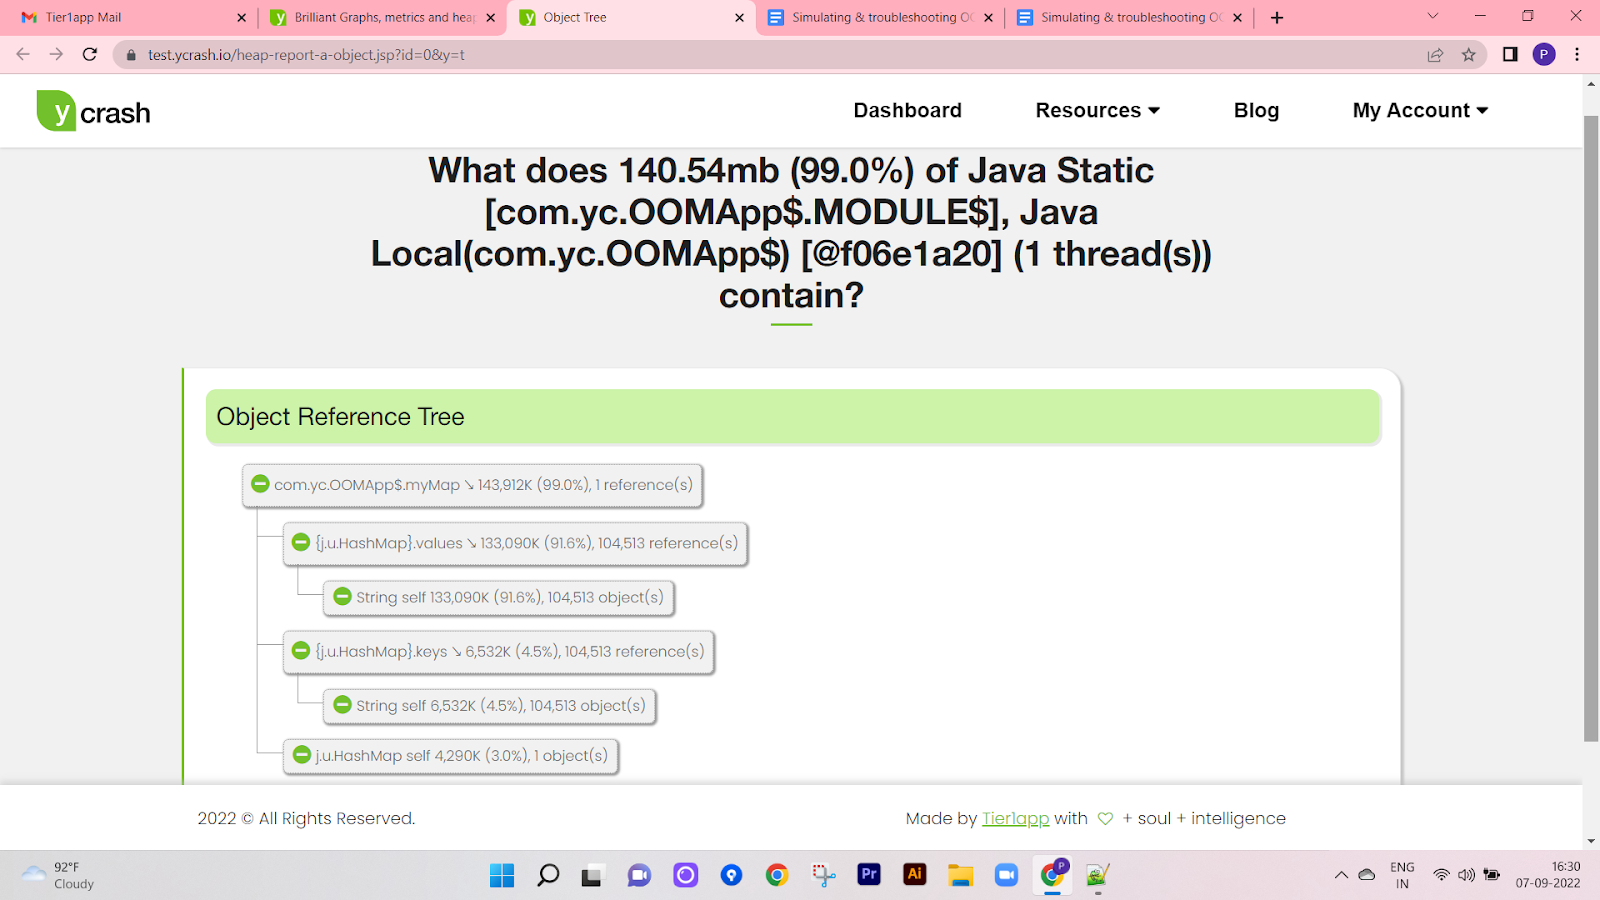
We used the automated approach. Once the captured artifacts were uploaded to the yCrash server, it instantly generated the below root cause analysis report highlighting the source of the problem.
Fig: Heap dump analysis report generated by the yCrash tool
Fig: yCrash tool pointing out the root cause of OutOfMemoryError
Above is the heap dump analysis report from the tool which precisely points out that the HashMap (i.e., myMap) data structure present in the com.yc.OOMApp$.myMap to be the root cause of memory leak. Also, the tool is reporting that this HashMap is holding 99% of memory.
Equipped with this information one can easily go ahead and fix the problematic code.


 Reply With Quote