
 LinkBack URL
 About LinkBacks

All multi-threaded applications are prone to deadlock. Modern Kotlin platform is no exception to it. In this post lets discuss how to simulate a deadlock in Kotlin and how you can troubleshoot it.
What is Deadlock?
First lets try to understand what Deadlock means. Several technical definitions arent clear. Deadlock is one among them ;-). Deadlocks definition goes like this: Deadlock is a situation where a set of processes are blocked because each process is holding a resource and waiting for another resource acquired by some other process. Its always easier to learn something new through examples and pictures. Lets look at the below practical example, which may help you to understand Deadlock better.
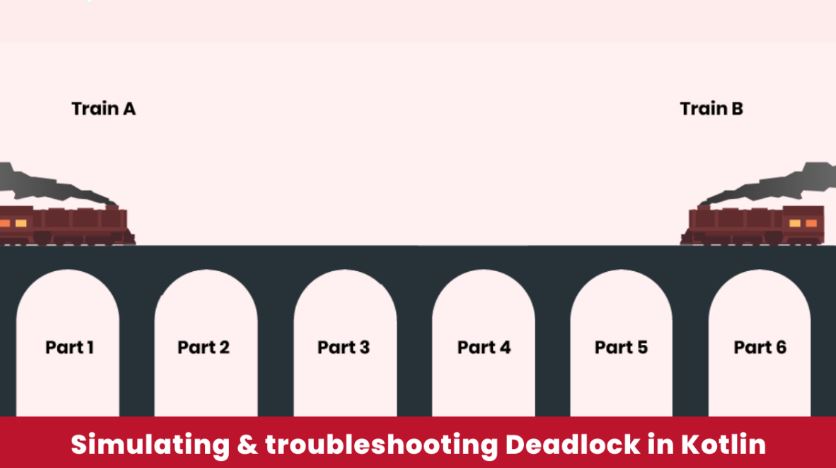
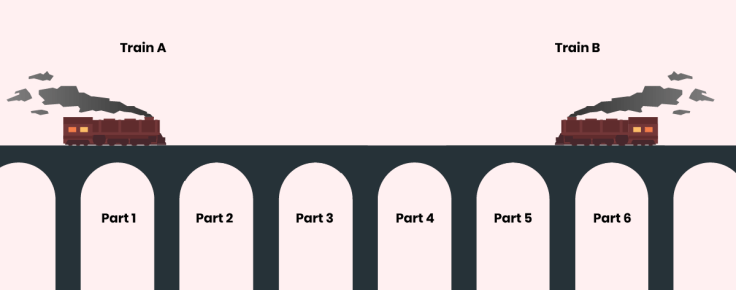
Fig1: Trains starting in the same track
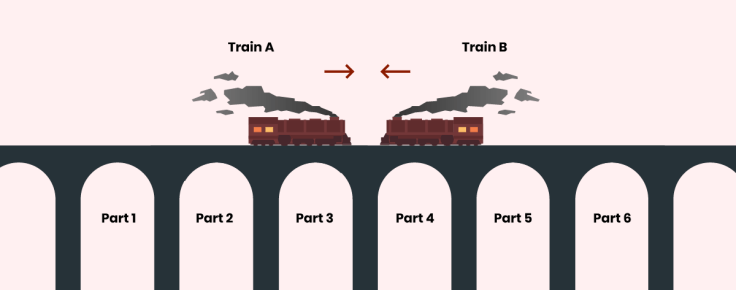
Fig2: Trains experiencing Deadlock
Lets say there is only one train track, and this train track has six parts(part-1, part-2, part-3, part-4, part-5, part-6). Train-A starts at part-1 and Train-B starts at Part-6 on the same train track at the same time. Lets say both trains travel at the same speed. Under this circumstance, Train-A and Train-B will reach a Deadlock state when they reach part-3 and part-4 of the train track. Because when Train-A is in part-3 of the train track, it will be stuck waiting for part-4 of the track, which Train-B holds. On the other hand, when Train-B is in part-4, it will be stuck waiting for part-3, which Train-A holds. Thus, both trains cant move forward. This is a classic Deadlock situation. Once a Deadlock happens in the application, it cannot be recovered. The only way to recover from Deadlock is to restart the application.
Kotlin Deadlock Program
Here is a sample program application, which generates deadlock between 2 kotlin threads.
package com.buggyapp

class DeadlockApp {
    fun start() {
        println("DeadlockApp:started")
        ThreadA().start()
        ThreadB().start()
    }
}

class ThreadA : Thread() {
    override fun run() {
        CoolObject.method1()
    }
}

class ThreadB : Thread() {
    override fun run() {
        HotObject.method2()
    }
}

object CoolObject {
    @Synchronized
    fun method1() {
        try { // Sleep for 10 seconds
            Thread.sleep(10 * 1000.toLong())
        } catch (e: Exception) {
        }
        HotObject.method2()
    }
}

object HotObject {
    @Synchronized
    fun method2() {
        try { // Sleep for 10 seconds
            Thread.sleep(10 * 1000.toLong())
        } catch (e: Exception) {
        }
        CoolObject.method1()
    }
}

fun main() {
    println(DeadlockApp().start())
You can notice the sample program contains the DeadlockApp class. This class has a start() method. In this method, 2 threads with the name ThreadA and ThreadB are launched.
run() method in ThreadA invokes CoolObject#method1(). Similarly run() method in ThreadB invokes HotObject#method2().
If you notice both CoolObject#method1() and HotObject#method2() are synchronized methods. When a method is synchronized, only one thread who has the lock of that object can execute that method. If another thread tries to execute the same method then it will go to the BLOCKED state, until the first thread completes executing the method. After entering the respective methods, both threads sleeps for 10 seconds and then continue to invoke other method i.e. CoolObject#method1() will invoke HotObject#method2() and HotObject#method2() will invoke CoolObject#method1().
So lets visualize what happens when above program is executed:
1. ThreadA acquires CoolObjects lock.
2. ThreadB acquires HotObjects lock.
3. ThreadA waits for HotObjects lock.
4. ThreadB waits for CoolObjects lock.
Thus, both threads will end up in classic Deadlock.
How to troubleshoot Kotlin Deadlock?
To troubleshoot deadlock problems, its sufficient if you can just capture thread dumps and analyze them through thread dump analysis tools such as fastThread, samurai. However most of the time, you will not know whether the actual problem in your application is deadlock or not. What you will notice is unresponsiveness from the application. Thus, its safe to capture all the prominent artifacts that are essential for troubleshooting such as: Garbage Collection log, thread dump, heap dump, netstat, iostat,
We used yCrash open source script, which would capture 360-degree data (GC log, 3 snapshots of thread dump, heap dump, netstat, iostat, vmstat, top, top -H, ) from your application stack within a minute and generate a bundle zip file. You can then either manually analyze these artifacts or upload it to yCrash server for automated analysis. When we uploaded the captured artifacts, it instantly generated a root cause analysis report highlighting the source of the problem.
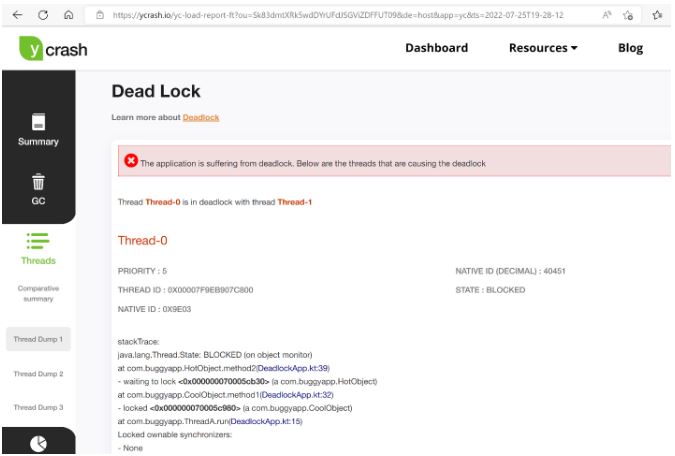
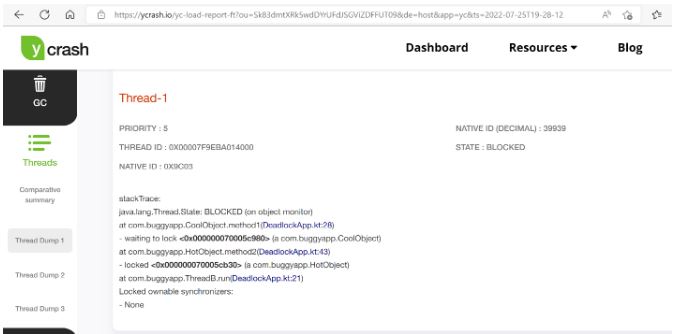
Fig: Stacktrace of two kotlin threads are suffering from deadlock
Above is the thread dump analysis report from the tool highlighting the two threads and their stacktrace which were causing the deadlock.
You can clearly see yCrash reporting Thread-0 and Thread-1 suffering from Deadlock. yCrash also reports the stack trace of Thread-0 and Thread-1. From the stack trace you can notice Thread-0 acquired the lock of CoolObject, and it is waiting for HotObject lock. On the other hand, Thread-1 acquired the lock of HotObject, and it is waiting for CoolObject lock. Now based on this stacktrace we know the exact line of code that is causing the problem.
Video
https://youtu.be/SLTiXqs__Qc

 Reply With Quote